
Bitcoin has evolved from an obscure experiment to a critical component of the global financial landscape. Traded around the clock and watched by millions, the Bitcoin USD rate now serves as a bellwether for the entire cryptocurrency ecosystem. Its price movements are driven by a dynamic interplay of macroeconomic forces, technological shifts, regulatory decisions, and investor sentiment. Given its reputation for volatility and its outsized influence, a deep dive into the Bitcoin-to-USD price, chart patterns, and market mechanics is essential for anyone seeking a grounded perspective—whether they are institutional investors, retail traders, or observers tracking financial innovation.
The Bitcoin USD Price: Key Drivers and Historical Trends
The value of Bitcoin against the US dollar is determined in real time on major global exchanges, often reflecting both broad economic conditions and crypto-specific catalysts.
Macroeconomic Influences on Price Fluctuations
Over the last decade, several major forces have driven significant moves in the price of Bitcoin in USD:
- Monetary Policy and Inflation: Investors often look to Bitcoin as a potential hedge when central banks expand the money supply or inflation expectations rise. The “digital gold” narrative often intensifies during periods of economic uncertainty, as seen during the COVID-19 pandemic responses.
- Institutional Adoption: Bull runs in Bitcoin’s price have coincided with increased institutional interest. For instance, announcements from companies like Tesla, and payment platforms such as PayPal, have often pushed prices higher.
- Regulatory Changes: Actions by global regulators—from approval or rejection of Bitcoin ETFs in the US to crackdowns in China—frequently inject volatility into the Bitcoin to USD markets.
- Market Liquidity and Sentiment: Unlike some traditional assets, Bitcoin can experience sharp moves due to thinner order books, leveraged trading, or viral market sentiment shifts.
Milestones and Extreme Movements
Bitcoin’s path has been punctuated by dramatic surges and swift corrections. For example, the run-up near the end of 2017 saw Bitcoin approach $20,000 before losing more than 80% of its value over the subsequent year. Another major inflection occurred in 2021, when institutional endorsements fueled new all-time highs beyond $60,000, followed by sharp, sentiment-driven pullbacks.
“Bitcoin’s ability to capture attention—and capital—comes from its unique combination of programmability, scarcity, and decentralization, but it’s the USD pairing that provides the clearest window into its global impact.”
— Digital asset strategist, Alexandra H.
Bitcoin USD Charts: Tools, Patterns, and Interpretations
Technical analysis plays a central role in the cryptocurrency world. Bitcoin USD price charts are a primary resource for both short-term traders and long-term investors aiming to spot both reversible corrections and secular trends.
Types of Charts and Key Metrics
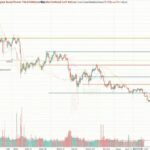
- Candlestick Charts: The preferred chart style for visualizing intra-day volatility and trend direction. Candlesticks represent price action over set intervals—such as minutes, hours, or days.
- Volume Overlay: Trading volume, displayed alongside price, helps clarify whether breakouts have strength behind them.
- Moving Averages: Simple (SMA) and exponential (EMA) moving averages provide perspective on prevailing trends, smoothing short-term noise to identify support/resistance zones.
- Relative Strength Index (RSI): Often used to spot overbought or oversold conditions. Values above 70 suggest that Bitcoin USD may be overextended upward, while values below 30 indicate potential for a rebound.
Popular Chart Patterns and Their Implications
Certain recurring patterns hold particular importance for Bitcoin-USD traders:
- Head and Shoulders: Seen as a reliable reversal pattern, signaling impending trend changes.
- Ascending Triangles: Typically indicate bullish continuation, with buyers pushing resistance higher over time.
- Double Tops and Bottoms: Sign of exhaustion in current trend and possible trend reversals.
Each of these provides entry or exit signals, especially when combined with broad market sentiment or news-driven catalysts.
On-Chain and Sentiment Analysis: Beyond Conventional Charting
Bitcoin’s blockchain offers a wealth of publicly available data that can complement conventional price and chart analyses:
On-Chain Metrics
- Active Addresses: Acts as a proxy for user engagement. Spikes in new or active wallets often precede price movement.
- Exchange Flows: Large transfers from wallets to exchanges can signal impending sells, whereas outflows may indicate accumulation.
- Hash Rate: Indicates the total computational power securing the network, which can indirectly reflect long-term confidence among miners.
Sentiment Analysis
Social media activity, Google Trends, and derivatives funding rates can foreshadow shifts in the Bitcoin USD price. Algorithms analyzing Twitter or Reddit narratives are now considered part of the sophisticated trader’s toolkit. For example, a flurry of negative news or regulatory uncertainty often leads to sustained declines, as seen during headline-driven downturns.
Real-World Factors Shaping the Bitcoin USD Relationship
Beyond the foundational drivers and chart signals, practical and geopolitical factors have a direct influence on Bitcoin USD valuation:
Economic Policies and Geopolitical Events
When countries face currency crises or capital controls, local demand for Bitcoin—often as a safe-haven or vehicle for international transfers—can surge, impacting global USD valuations.
Recent years have also seen governments toy with introducing central bank digital currencies (CBDCs) or clarifying tax treatment for Bitcoin, both of which move markets. During periods of political instability, such as the Russian invasion of Ukraine, increases in peer-to-peer Bitcoin trading volumes have been observed, underscoring its role as digital money under duress.
Institutional Investment Strategies
The entry of hedge funds, family offices, and publicly traded companies into the Bitcoin market has spurred the development of sophisticated financial products. Futures, options, and spot ETFs—when accessible—add liquidity but can also amplify volatility as large players enter or exit positions.
Navigating Volatility: Strategies for Market Participants
Bitcoin’s volatility attracts risk-tolerant investors but also demands robust risk management. Various strategies have emerged:
- Dollar-Cost Averaging: Gradually buying fixed dollar amounts of Bitcoin reduces the impact of sharp price swings.
- Hedging with Derivatives: Using futures contracts to hedge large positions is common among institutional participants.
- Long-Term Holding (“HODLing”): Many advocates resist timing the market and instead hold for years, betting on Bitcoin’s adoption curve and digital scarcity.
For traders, understanding the unique 24/7 nature of crypto markets and the high correlation with market sentiment is crucial. Tight stop-losses, diversified portfolios, and frequent rebalancing are standard safeguards.
Conclusion: The Evolving Landscape of Bitcoin USD Markets
The Bitcoin USD price is more than a number on an exchange—it’s a reflection of innovation, policy shifts, investor psychology, and sometimes even global turmoil. While volatility remains a permanent fixture, the robust toolkit now available—combining technical, on-chain, and sentiment analysis—helps participants make sense of the noise.
Staying informed, adapting strategies to changing conditions, and leveraging multiple data points are fundamental to thriving in this unpredictable, often exhilarating market. As adoption matures and the landscape continues to change, Bitcoin’s USD pairing will remain at the epicenter of both opportunities and challenges in cryptocurrency investing.
FAQs
What drives the Bitcoin USD price up or down?
Multiple factors including macroeconomic trends, regulatory developments, institutional adoption, and market sentiment influence Bitcoin’s value against the US dollar. Key news events and shifts in liquidity can lead to dramatic price movements.
How do I read a Bitcoin USD price chart?
Candlestick charts offer a detailed look at Bitcoin’s price changes over time, showing high, low, opening, and closing prices for each interval. Tools like moving averages and RSI help traders spot trends and potential turning points.
Is Bitcoin USD more volatile than traditional currencies?
Yes, Bitcoin typically experiences far greater price swings than most fiat currencies due to its relatively lower market depth, speculative trading, and its status as an emerging asset class.
Can on-chain data predict Bitcoin USD movements?
While on-chain data can reveal useful trends, such as rising exchange inflows or wallet activity, it should be combined with other forms of analysis for the best insights. No single metric can guarantee accurate price predictions.
Why is the USD used as the primary pairing for Bitcoin?
The US dollar’s global reserve status and widespread use in international finance make it the default reference currency for exchange rates, including cryptocurrencies. This makes Bitcoin’s USD price a central metric for global markets.
What strategies can help manage Bitcoin USD volatility?
Risk-mitigation tactics include dollar-cost averaging, portfolio diversification, and using stop-losses. Long-term holding remains popular among those who believe in Bitcoin’s technological and monetary potential.


Leave a comment